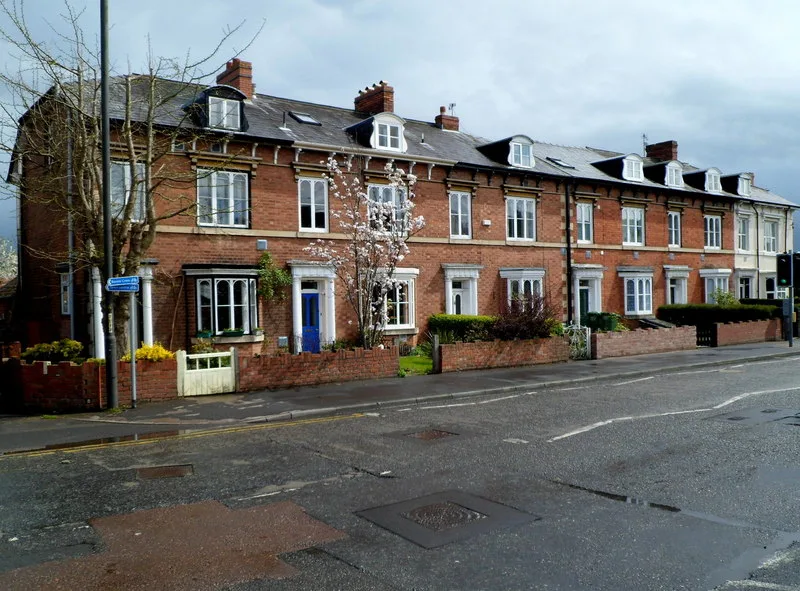

The county average rose 4.8% in the year to June 2026, 77th of 295 English areas. Terraces and semis rose 5.7%, flats just 2%, and sales are below 2024.
The average Herefordshire home was worth £289,715 in June 2026, according to the UK House Price Index published by HM Land Registry on 19 August. That is £13,290 more than a year earlier, a rise of 4.8 per cent.
It is well ahead of England, where the average rose 1.8 per cent to £293,262. Herefordshire is closing on the national figure without having caught it: the gap is now £3,547.
One caveat before the detail. UKHPI is a mean average, not a median, so a handful of large sales pull it up. It is the best month-by-month measure there is for a whole county, but it is not what a typical house costs.
Where that puts Herefordshire nationally
We ranked all 295 English local authority areas in the full June 2026 index file by annual change. Herefordshire comes 77th. Prices fell over the year in 62 of those areas, so the county is comfortably in the rising group, and in the faster third of it, but nowhere near the top. Northumberland led England at 12.6 per cent.
The neighbours are closer than the national comparison suggests:
| Area | Average price | Change on the year |
|---|---|---|
| Malvern Hills | £350,906 | +8.0% |
| Shropshire | £284,036 | +4.9% |
| Herefordshire | £289,715 | +4.8% |
| Gloucestershire | £318,029 | +4.4% |
| Worcestershire | £289,375 | +3.4% |
| Powys | £231,004 | +2.9% |
| Forest of Dean | £288,524 | +1.9% |
| England | £293,262 | +1.8% |
| Monmouthshire | £332,145 | −0.7% |
That is a change from last month. On the May figures Herefordshire was rising faster than every county around it. On the June figures Shropshire has edged ahead by a tenth of a percentage point, and Malvern Hills, which starts at the Herefordshire border, is rising at nearly twice the rate.
Terraces and semis are doing the work
The county average hides a wide split by property type.
The cheaper end of the market is moving fastest, with one exception. Terraced homes reached £209,228, up 5.7 per cent, and semi-detached £279,614, also up 5.7 per cent. Detached homes, at £446,120, managed 4.3 per cent.
Flats are the exception, and they are stuck. At £126,650 they rose 2.0 per cent, barely above England’s rate for all property types. A flat in Herefordshire now costs less than a third of a detached house.
First-time buyers paid £223,932 on average, up 5.3 per cent, or £11,208 in a year.
The record is still in November
Herefordshire has not made a new high. The county peaked at £291,135 in November 2025, and June’s figure is £1,420 short of it.
The last year has been a sawtooth rather than a climb. Prices dipped to £282,246 in January, recovered to £290,136 in April, fell 0.9 per cent in May, then rose 0.8 per cent in June. The 4.8 per cent annual figure is measured from a soft base: June 2025 was itself 0.6 per cent down on the year before.
Fewer people are moving
The number of homes changing hands tells a different story from the price.
HM Land Registry holds sales volumes back, so the most recent publishable count is about three months behind the price. Taking January to April, the months with complete figures in each year:
- 2024: 651 sales
- 2025: 902 sales
- 2026: 582 sales
The 2025 number is distorted and should not be read as a fall from a healthy market. Stamp duty thresholds changed on 1 April 2025, and Herefordshire recorded 392 sales in March 2025 and 117 in April, either side of the deadline. The honest comparison is with 2024, and on that basis sales in the first four months of 2026 were down about 11 per cent.
Prices rising while transactions fall is what a thin market looks like. There is less being sold, and what sells is holding its value.
What it means for you
- If you are selling a terraced or semi-detached home, these are the two types that gained most over the year, both 5.7 per cent. The index is a county-wide mean, so treat it as direction rather than a valuation.
- If you own a flat, the picture is flatter than the headline. A 2.0 per cent rise is roughly a third of the rate for semis and terraces. In cash terms the average flat gained £2,450 over the year, against £15,069 for a semi and £18,349 for a detached house.
- If you are buying, fewer completions means less competition on any given house, but also less choice. The first-time buyer average of £223,932 is the figure to check a mortgage against, not the £289,715 headline.
- If you want the figure for your own town, the county mean is not it. Our Hereford house prices page carries median sold prices for Hereford, Leominster, Ross-on-Wye, Ledbury, Bromyard and Kington, worked out from HM Land Registry’s record of completed sales.
Sources
- UK House Price Index for June 2026, HM Land Registry, published 19 August 2026, and the Herefordshire page of the index.
- UK HPI full file, June 2026 (CSV), used for the national ranking, the neighbour comparisons, the property type splits and the monthly sales volumes. We ranked the 295 areas with an English local authority district code by their twelve-month change.
More from us on this:
- Hereford house prices: sold prices town by town, and what a Hereford postcode actually buys.
- Hereford planning: the housing numbers behind the supply side of this.
- Hereford bypass: £44.7m cost, Cabinet decides 10 September: the road the council says unlocks 14,000 homes.
Update, 28 September 2026: Land Registry’s July release revised the June 2026 figures. Herefordshire’s June average is now £288,979, up 4.5 per cent on a year earlier, rather than the £289,715 and 4.8 per cent first published. Our July house prices story has the latest figures.
Have your say