
The average Herefordshire home reached a record £292,771 in September 2026, up 1.7% in a year. The gap to England is the narrowest since October 2024.
The average Herefordshire home was worth a record £292,771 in September 2026. That is the highest figure the UK House Price Index has recorded for the county. HM Land Registry published it on Wednesday 18 November.
Prices rose 0.3 per cent in the month and 1.7 per cent over the year, up £5,005 on September 2025. August, at £291,867, had already set a record, so this is the second high in a row.
Overview
- Average price: £292,771 in September 2026, a county record.
- Over the year: up 1.7 per cent, or £5,005.
- Against England: £227 below the England average of £292,998, the narrowest gap since October 2024.
- First-time buyers: an average of £226,307, up 2.0 per cent.
- Flats: the only type to fall, down 1.5 per cent to £127,498.
UKHPI is a mean average, not a median. A handful of large sales pull it up, so it is a good guide to the direction of the county market but not to what a typical house costs.
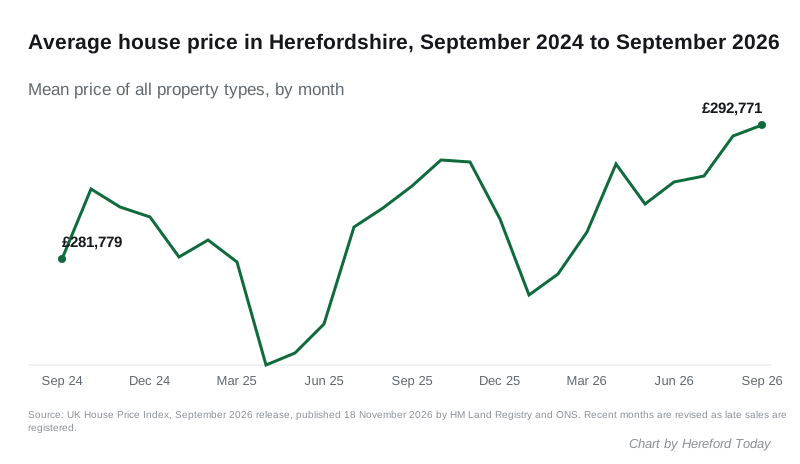
Almost level with England
Herefordshire homes have been cheaper than the England average every month since March 2024. In January 2026 the gap was £10,479.
It has closed since then. England’s average fell 0.4 per cent in September to £292,998, while Herefordshire’s rose. That leaves the county £227 behind, the smallest gap since October 2024, when it was £106.
Herefordshire is now ninth of the 30 local authority areas in the West Midlands region by average price, and 158th of 295 in England.
How the neighbours compare
The full index file gives these figures for September 2026:
| Area | Average price | Change on a year |
|---|---|---|
| Malvern Hills | £352,108 | up 3.8% |
| Monmouthshire | £338,406 | up 3.7% |
| Gloucestershire | £317,210 | down 0.2% |
| Forest of Dean | £293,712 | down 1.0% |
| England | £292,998 | up 0.8% |
| Herefordshire | £292,771 | up 1.7% |
| Worcestershire | £289,618 | up 0.7% |
| Shropshire | £278,284 | down 1.0% |
| Powys | £238,121 | up 0.3% |
| West Midlands region | £237,174 | up 1.8% |
Herefordshire is now about £1,000 cheaper than the Forest of Dean, its neighbour over the Gloucestershire border, and about £14,500 dearer than Shropshire.
By type of home
| Type | September 2026 | September 2025 | Change |
|---|---|---|---|
| Detached | £451,242 | £442,965 | up 1.9% |
| Semi-detached | £282,095 | £275,632 | up 2.3% |
| Terraced | £211,791 | £207,913 | up 1.9% |
| Flat or maisonette | £127,498 | £129,461 | down 1.5% |
Over ten years the county average has risen by £87,029, from £205,742 in September 2016.
July has been revised down
Land Registry revises recent months as late sales are registered. July 2026, which we reported at £289,607 in September, now stands at £288,581, up 1.5 per cent on the year. August has been revised up, from £291,495 to £291,867.
What it means for you
- If you are selling, the county average has never been higher, though the annual rise of 1.7 per cent is modest.
- If you are buying a first home, the average first-time buyer paid £226,307, against £359,280 for a buyer who already owned a home.
- If you own a flat, flats are the one type of home losing value over the year.
- For one street or postcode, the county index is too broad. Our Hereford house prices page has sold prices town by town, from Ross-on-Wye to Kington.
Sources
- HM Land Registry, UK House Price Index for September 2026, published 18 November 2026.
- HM Land Registry, UK HPI full file, September 2026, for the Herefordshire monthly series, property and buyer types, neighbouring areas, England, and the rankings of the 30 West Midlands and 295 English local authority areas.
- HM Land Registry, UK HPI full file, August 2026, for the earlier August and July estimates.
Have your say